|
This page is an attempt to quantify the numbers of each stamp, broken down by sport, print run and perforations. Some figures are definite, some are estimates. The known quantities belong to the third print run only, and total number of stamps. With the second print run estimated to have started at the beginning of 2005 and therefore lasting 12 months, the first print run sheets would have lasted 6 months. Thus a 1:2 ratio of first to second has been assumed. It is then assumed that the Bath perforating exercise may have lasted two months until the Wincanton perforator was introduced, thus another 1:2 ratio was applied regarding numbers of the two perforations.
|
Print Run
|
1
|
2
|
3
|
|
|
Perforations
|
Bath
|
Wincanton
|
Totals
|
|
Commons
|
840 est
|
1680 est
|
5026 est
|
1554
|
9100
|
|
Falling Man
|
60 est
|
120 est
|
359 est
|
111
|
650
|
|
Splash
|
60 est
|
120 est
|
359 est
|
111
|
650
|
|
Falling Man birds moved 1
|
|
|
|
62
|
62
|
|
Falling Man birds moved 2
|
|
|
|
40
|
40
|
|
Weathervane
|
|
|
|
60
|
60
|
|
Bigger Splash
|
|
|
|
60
|
60
|
|
Total stamps
|
960 est
|
1920 est
|
5744 est
|
1998
|
10622
|
|
Total sheets
|
60 est
|
120 est
|
359 est
|
111
|
650
|
|
Please dont take these figures too seriously. As I have said, they are only estimates and are based on unfluctuating sales over 18 months, and cannot take into consideration stock sizes when there was a change. And, perhaps most importantly, you cannot distinguish between print runs most of the time. Only 1512 of the 10622 stamps could be assigned to a particular print run, and most of those are the Bath perforated ones.
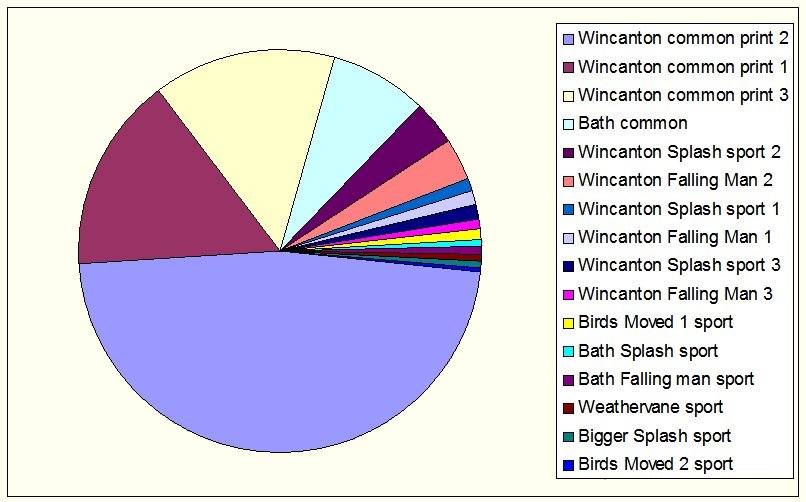
But if you do like this, here is the distribution as a pi chart; it puts the sports into perspective!
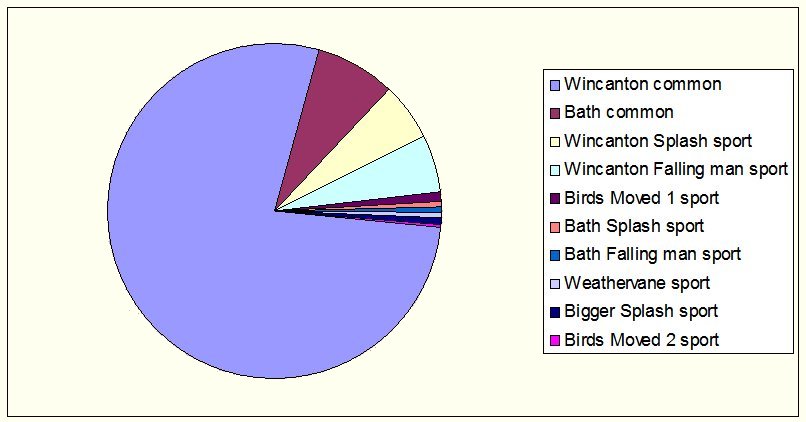
But if you prefer it more simple and categorised as you might see the stamps advertised on a well known auction site ....
|